In March of this year, NASA announced the impact of a small asteroid against Earth’s atmosphere. The asteroid was predicted two hours before impact and was not large enough to do any damage. However, it still sparked the conversation about increasing planetary defenses against near-Earth Objects, such as fireballs and bolides. Fireballs and bolides are asteroids that break up open entry to Earth’s atmosphere. In 2022, NASA released decades of fireball data to increase the understanding of how asteroids break up in the atmosphere to cause fireballs and bolides. With this data, the fireball impact energy (Figure 1) and total fireball events per year (Figure 2) were analyzed. Also, the prediction of fireball and bolide occurrences will be made for 2022 and future years compared to the number of fireball and bolide events that occurred in 2021 with a machine learning technique, linear regression supervised learning (Figure 3 and Figure 4). The data was explored and analyzed in Juypter Notebook using Pandas, NumPy, Matplotlib, and Scikit-learn. The frequency of impact energy plot, Figure 1, shows that the log of impact energy occurred the most from -1 to -3 (kt) and above 1 (kt) are more likely to be rare historic events. There was a large increase in fireball and bolide events per year, Figure 2, from 1980 to 1994 and an even larger increase occurred in 1996. This increase in fireball and bolide events per year could be due to advances in technology. The linear regression supervised learning plot, Figure 4, shows that the majority of the test data fits the model. The mean absolute error is 6 years which is the average size of errors in the prediction. The linear regression supervised learning model can now be used to predict fireball and bolide events.
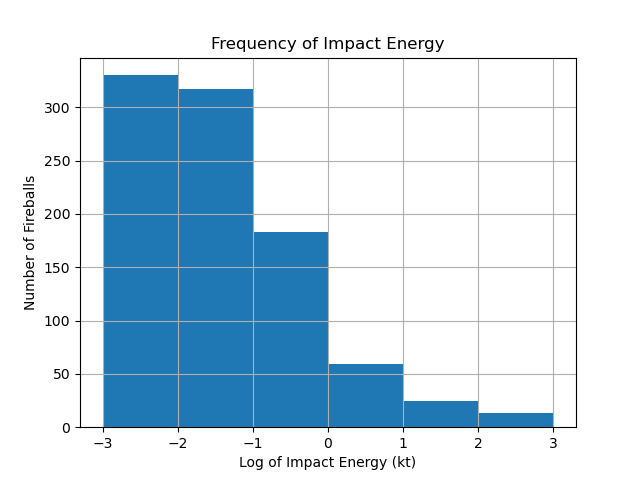
Figure 1. Frequency of impact energy. Histogram of the log of impact energy where one kiloton (kt) of TNT releases 4.184×10^12 J of energy.
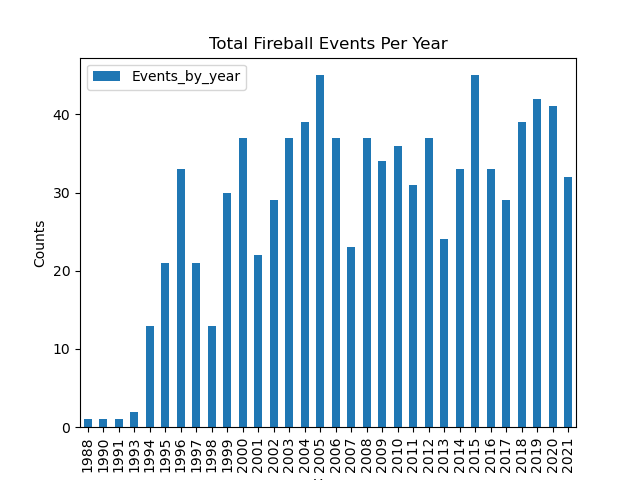
Figure 2. Total fireball events per year. Fireball and bolide events were observed each year from 1980 to 2021.
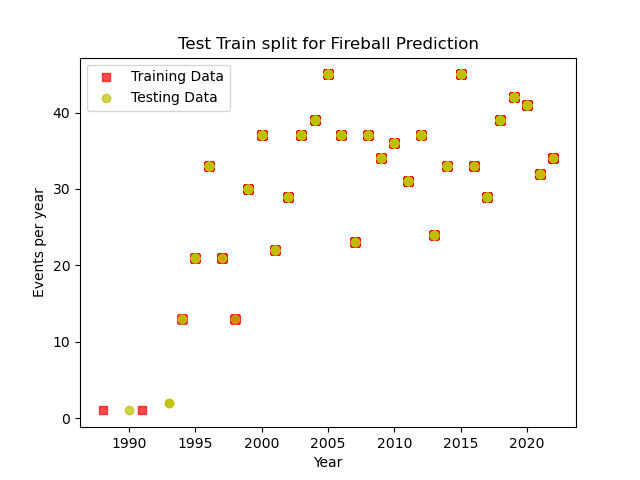
Figure 3. Test train split for fireball prediction. The data for events per year is randomly split to create data points to test and train the linear regression supervised learning model. The training data, red data points, are used to create the linear model which is then used to show how well the model predicts the testing data, yellow data points.
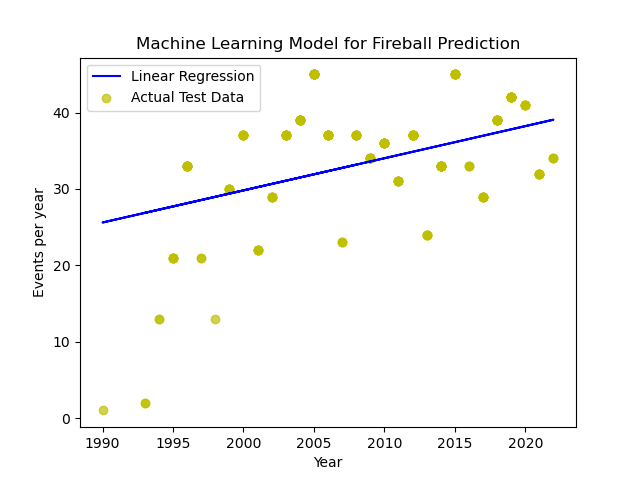
Figure 4. Machine learning model for fireball prediction. A linear regression line was created from the prediction values and plotted along with test data values.